Pressure history
Pressure Trend & Logging
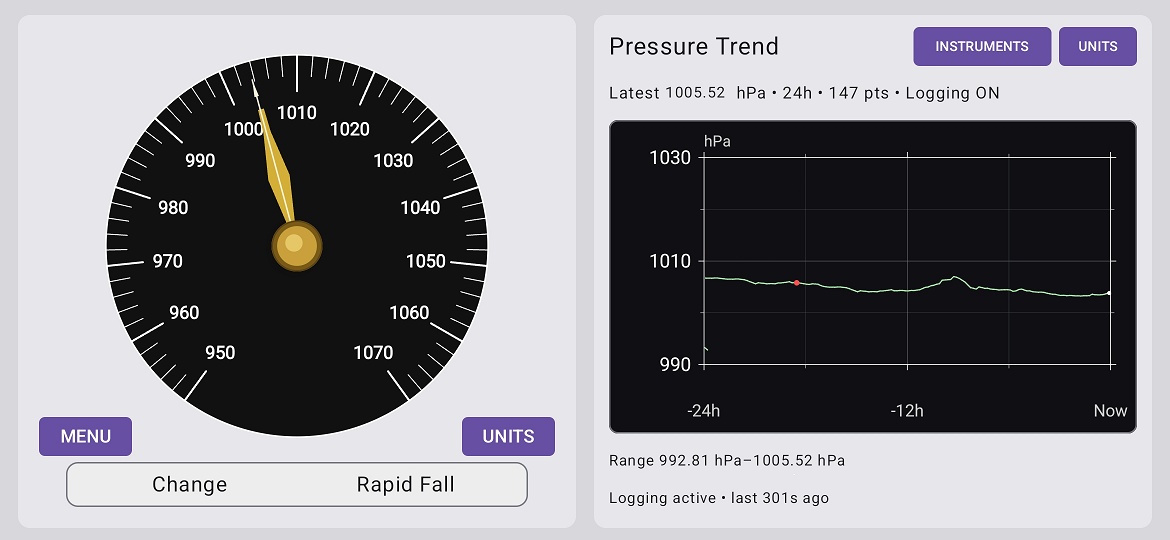
A truthful 12-hour pressure graph backed by a persistent pressure log and low-duty adaptive sampling.
What the graph means
The graph plots real pressure samples. It does not draw a false line forward to “now” when there has been no recent measurement, and it breaks the plotted line across large sampling gaps.
Adaptive ECO sampling
When logging in the background, Marine Barometer wakes briefly, takes a pressure sample, records it and returns the device to sleep. The interval adapts to the measured wake time, normally within roughly 10 to 30 minutes, to keep background duty very low.
When the app is visible the pressure display can remain responsive, but Pressure Trend points still use the controlled sampling cadence rather than filling the graph with screen-refresh data.
Start, Pause, Resume and Stop
PAUSE keeps the current logging session and graph but stops collecting samples. RESUME continues that same session and takes a fresh sample. STOP ends the session.
Pause is particularly useful when driving or walking to another elevation, because altitude changes can otherwise masquerade as weather-related pressure changes.
Files
The dated pressure_log_YYYYMMDD_HHMMSS.csv file is the authoritative pressure history for a logging session. pressure_graph_current.csv is the current graph/display cache. Calibration observations are stored separately in calibration_history.csv.